
Last updated on

The SEO world is packed with acronyms.
You’ll frequently encounter terms like SEO, FID, and INP, especially when discussing page speed.
One of the newer metrics is INP, or Interaction to Next Paint. This measures how quickly a page responds to user interactions and is assessed using both Google Chrome’s lab and field data.
Interaction to Next Paint (INP) is a new Core Web Vitals metric that gauges the overall delay of a page’s interactions throughout the user experience.
For instance, when you click the Add to Cart button on a product page, INP measures the time it takes for the button’s visual state to update, such as changing color upon a click.
Heavy scripts running on the page can cause temporary freezes, which can adversely affect the INP metric.
You might observe that the first button updates its visual state immediately, while the second button takes a few seconds to reflect the change.
The key difference between INP and First Input Delay (FID) is that FID only measures the delay of the initial interaction on a page. It focuses solely on the input delay without considering how long the browser takes to respond.
In contrast, INP evaluates all user interactions and measures the time it takes for the browser to process each one. Specifically, INP includes:
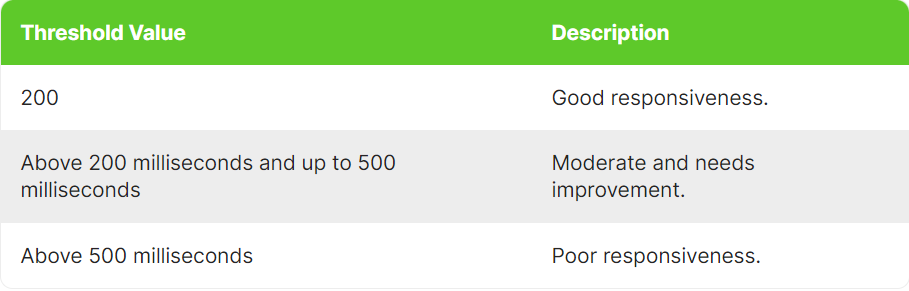
Google recommends that a good INP value is 200 milliseconds or less. The thresholds for INP are as follows:
However, Google also mentions that INP is still in an experimental phase, and the guidance regarding this metric may evolve over time.
Google measures INP using anonymous data from Chrome browsers, focusing on the single longest interactions recorded during a user’s visit to a page.
Each interaction is divided into three phases: presentation time, processing time, and input delay. The callback for these events captures the total time for all phases combined.
For pages with fewer than 50 interactions, INP considers the interaction with the longest delay. For pages with more than 50 interactions, it excludes the longest interactions from every set of 50 interactions.
After a user leaves the page, these measurements are sent to the Chrome User Experience Report (CrUX), which aggregates the data to offer insights into real-world user experiences, also known as field data.
To optimize your website’s performance, it’s essential to understand the causes of high INP values. Common factors include:
To diagnose high INP values, first consult our guide on measuring CWV metrics and try the troubleshooting techniques provided there. If those steps don’t resolve the issue, the “Performance” report in Chrome (or preferably, Canary) can be very useful.
Here’s how to use it:
This adjustment is crucial because Google’s field data is collected from real user devices. You might not encounter INP issues on a high-performance device, making it challenging to debug. By configuring these settings, you better approximate real device conditions.
For a visual guide on this process, check out this video. I recommend following along as you read the article to gain practical experience.
In the video, we observed that long tasks extend the time it takes for interactions to complete, with specific JavaScript files identified as responsible for these delays.
By expanding the Interactions section, you can view a detailed breakdown of the long task related to each interaction. Clicking on the script URLs will open the corresponding lines of JavaScript code responsible for the delay, allowing you to target these areas for optimization.
For example, a 321 ms long interaction is broken down as follows:
In the main thread timeline, you’ll see a long red bar representing the total duration of the long task. Below this red bar, a yellow bar labeled “Evaluate Script” indicates that JavaScript execution is the primary cause of the long task.
In the first screenshot, the time between (point 1) and (point 2) shows the delay caused by the red long task due to script evaluation.
Script evaluation is a crucial part of JavaScript execution. During this phase, the browser processes the code line by line, which includes tasks such as assigning values to variables, defining functions, and setting up event listeners.
Users may interact with a page that is still in the process of loading, parsing, compiling, and evaluating JavaScript files.
When a user interacts with an element (like clicking or tapping) while the browser is evaluating a script that includes an event listener for that interaction, the response may be delayed until the script evaluation is complete. This delay ensures that the event listener is properly registered and ready to handle the interaction.
In the screenshot (point 2), the 207 ms delay likely happened because the browser was still evaluating the script with the event listener for the click.
This situation highlights the importance of Total Blocking Time (TBT), which measures the total time long tasks (longer than 50 ms) block the main thread before the page becomes interactive.
If TBT is high and users interact with the website immediately after the page loads, the browser may struggle to respond quickly to those interactions.
While TBT is not part of the Core Web Vitals (CWV), it often correlates with high INP values. To improve INP, you should focus on reducing TBT.
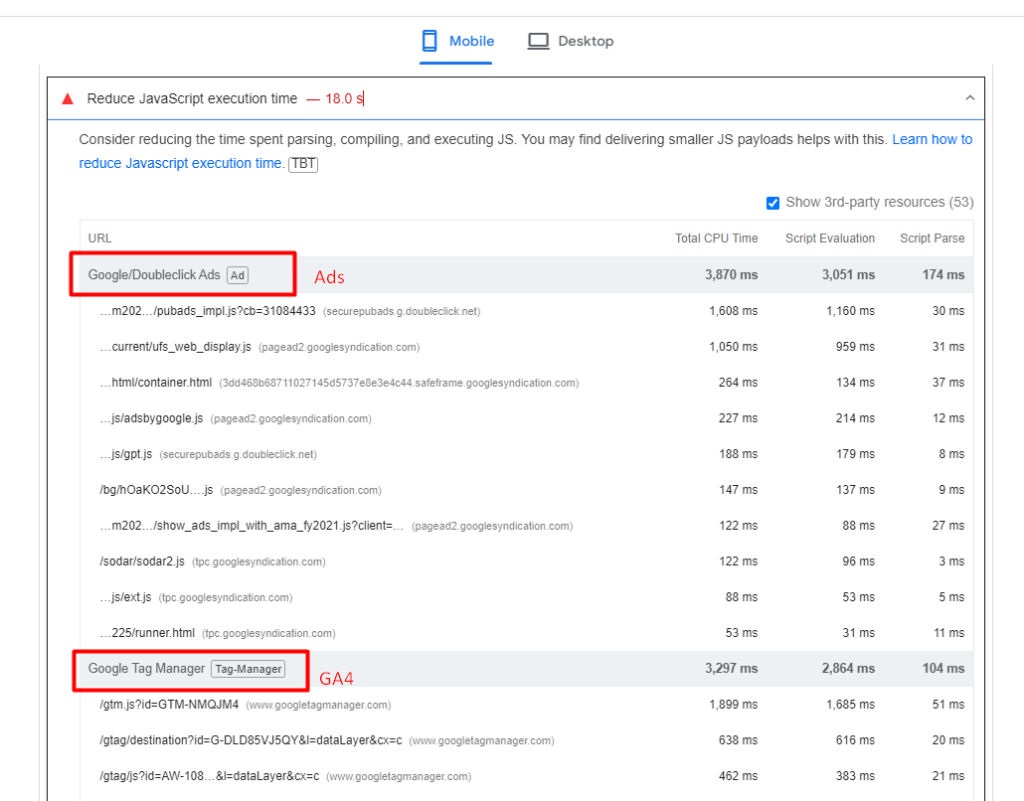
Analytics scripts—like Google Analytics 4, tracking pixels, Google reCAPTCHA, or AdSense ads—often contribute to high script evaluation times, which can increase Total Blocking Time (TBT).
To reduce TBT, consider delaying the loading of non-essential scripts until after the initial page content has fully loaded.
It’s also crucial to prioritize scripts based on their impact on user experience. Essential scripts that are critical for key interactions should be loaded first, while less critical scripts can be deferred.
Improving your INP is not a guaranteed fix for immediate SEO success. Rather, it is just one element in a broader strategy of quality enhancements that can positively impact your overall SEO performance.
Other important factors to consider include optimizing your content, acquiring high-quality backlinks, refining meta tags and descriptions, implementing structured data, enhancing site architecture, and addressing crawl errors, among other tasks.
Original news from SearchEngineJournal