
Last updated on

Much emphasis is placed on achieving a ‘low bounce rate,’ yet this metric remains widely misunderstood within the realms of SEO and digital marketing. This article delves into the intricacies of bounce rate, highlighting its complexities beyond surface interpretations.
We will uncover why bounce rate defies straightforward measurement and provide insights into effectively analyzing it using Google Analytics 4 exploration reports. To grasp bounce rate’s significance, it’s crucial first to define ‘engaged sessions’ as outlined by GA4.
In GA4, an engaged session is defined by meeting any of the following criteria:
To illustrate, if a user visits your homepage and departs without triggering a key event, this results in a 100 percent bounce rate for that session.
Conversely, if a user navigates to a second page or completes a defined key event, such as signing up for a newsletter, the bounce rate for that session would be 0%.
Bounce rate represents the percentage of unengaged sessions and is calculated using the following formula:
(total sessions/unengaged sessions)*100.
Reducing the bounce rate isn’t just about visiting a second page; it also involves triggering key events.
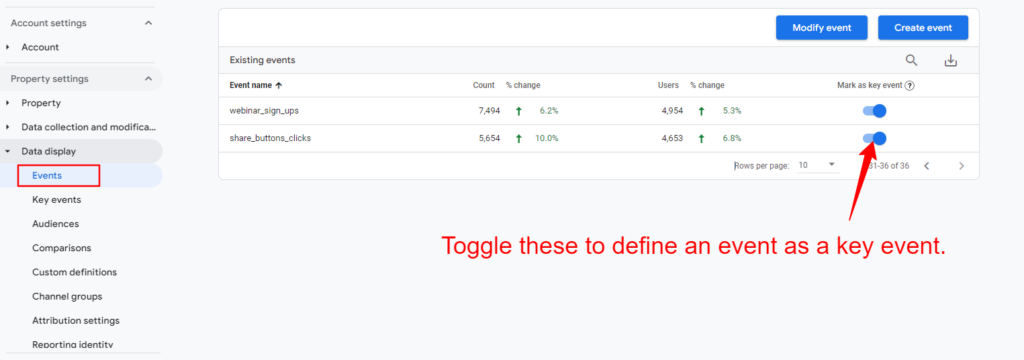
In Google Analytics 4 (GA4), you can designate any event, whether built-in or custom-defined, as a key event (formerly known as a conversion). When this key event occurs during a session, it counts as a non-bounce visit.
Here’s how to set any event as a key event:
As a marketer, you might need to adjust the default 10-second timer for engaged sessions to better suit your project’s needs.
For instance, if you have a blog article, you may want to set the timer to 20 seconds. For a product page where users typically spend more time exploring details, you might increase the timer to 30 seconds to more accurately reflect user engagement.
To change the timer:
So, it’s not as simple as saying, “Example.com has a bounce rate of 43 percent, and example2.com has a bounce rate of 20 percent; therefore, example2.com performs better.”
For example, if you search for what’s on at the cinema and land on a website where you have to navigate through five pages to find the showtimes, the website might have a low bounce rate but a poor user experience. In this case, a low bounce rate is misleading if considered good.
Additionally, measuring the bounce rate for an entire website can be problematic when you have various templates with different designs and track key events (conversions) differently. This variation makes it difficult to draw meaningful conclusions from the bounce rate alone.
In most cases, this indicates that your marketing is effective and well-targeted, with visitors engaging with your content and seeking more information.
Keep in mind, while bounce rate itself is not a ranking factor, user engagement with deeper page navigation can be an important signal to Google, as noted by Google’s Pandu Nayak during hearings.
Therefore, it could be beneficial to track the number of sessions with two or more pageviews in GA4, and consider this as a key performance indicator (KPI) in your reports.
If you want to identify how many visitors have more than two page views in a session, you can easily set this up in GA4.
Here’s how:
This setup will include all users who viewed more than two pages within the same session in your audience.
You can also create audiences with different levels of granularity, such as sessions with exactly two or three pageviews or more than three pageviews.
You can later use your custom audiences to filter your standard reports.
Next time your boss or client asks, “Why is my bounce rate so high?”—first, share this article with them.
Second, conduct a thorough bounce rate audit to understand the underlying issues.
Here’s my approach to doing it:
Examine the bounce rates on your website for a specific period. This is the simplest way to report on bounce rate.
To do this:
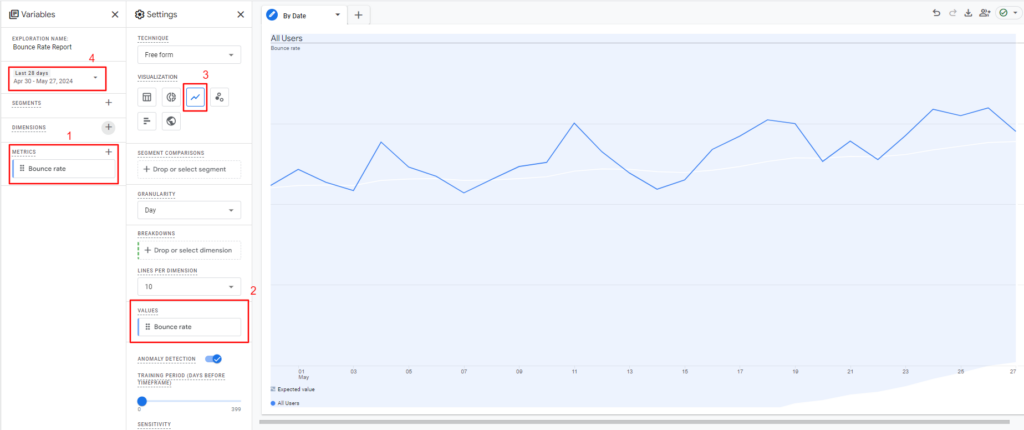
If you observe spikes in the chart, it may indicate a change made to the website that influenced the bounce rate.
When running a lead generation campaign across multiple landing pages, evaluating which pages convert well or poorly is crucial for optimizing performance.
Another useful application of page-level bounce reports is for A/B testing.
Here’s how to do it:
Tip: Instead of creating a new blank exploration report, you can add another tab to the same report and change only the configuration.
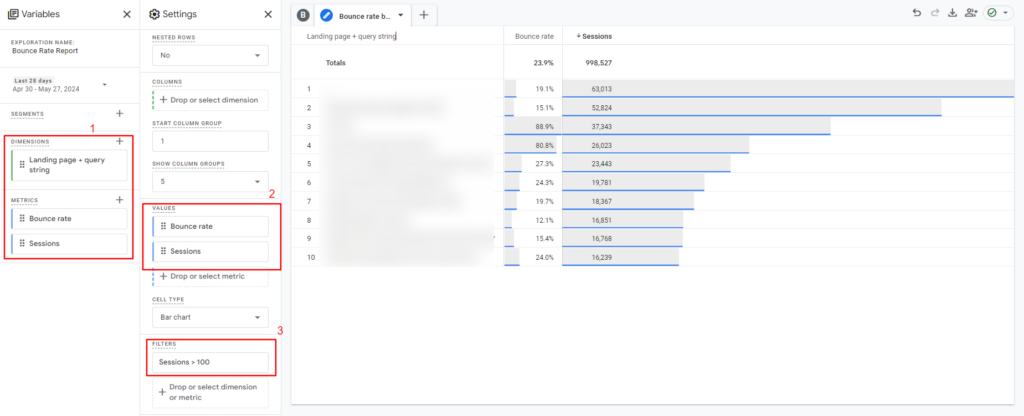
If we don’t filter by session count, we’ll see bounce rates for pages with only one or two sessions, which aren’t informative.
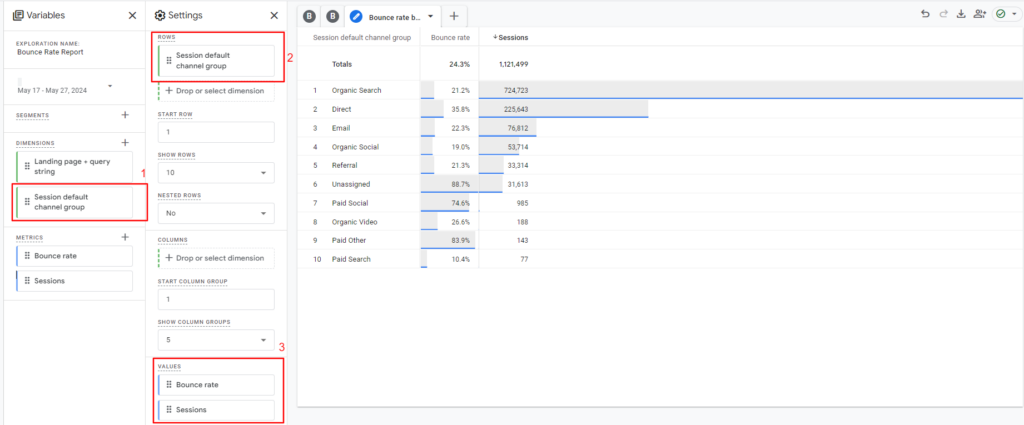
After completing the above step, repeat the process for each channel to achieve a comprehensive understanding of which content and traffic sources generate the most or least engaged visits.
Bounce rates vary significantly depending on the traffic source.
For instance, search traffic often results in a low bounce rate, whereas social and display traffic tend to yield higher bounce rates.
Therefore, it’s essential to evaluate bounce rates at both the channel and page levels.
The bounce rate tends to be higher from social media and display channels compared to “inbound” channels due to these factors:
In contrast, inbound channels like organic search and paid search generally have lower bounce rates because users actively search for and are interested in what is being promoted.
Thus, you engage them during the “doing” phase of their buyer’s journey, based on the specific search term.
To explore each aspect further:
Here’s a quick task: Create a line graph to visualize the bounce rate of your organic traffic.
Next, delve deeper into the data to identify patterns or reasons why certain pages or sources exhibit higher or lower bounce rates.
Present your findings in a clear format, share them with relevant stakeholders, and treat yourself to a well-deserved coffee break.
Sometimes, you may come across web pages that appear in search engine results for terms with multiple meanings.
For instance, I recently found a page on a website I oversee that ranks at the top for the search term ‘Alang Alang’ (the name of a villa), even though ‘Alang Alang’ is also the title of a film.
The villa page experienced a high bounce rate, partly because some visitors arriving on the page were actually seeking information about the film rather than the villa.
By conducting keyword and competition research, you can promptly ascertain if any of your pages rank well for keywords that may have multiple interpretations.
Once identified, you have three choices:
Now that you’ve identified the issue, you’re ready to implement some changes.
These recommendations may not apply universally, as they are based on your study’s findings, but they should provide a solid foundation:
It’s crucial to track custom events as “key events” (conversions) in order for Google Analytics to classify actions like newsletter sign-ups as non-bounce events, even if the user doesn’t navigate to another page afterward.
Understanding bounce rate isn’t a matter of simply categorizing it as “high” or “low.” It varies depending on multiple factors, and there’s no definitive answer to whether a high bounce rate is inherently bad.
If you’ve correctly defined your ‘key events’ (conversions) and configured GA4 settings according to your objectives, a high bounce rate (over 90%) should raise concerns because it suggests visitors aren’t sufficiently engaging with your website.
However, default GA4 settings may not provide reliable data, as discussed earlier.
Avoid assumptions. Conduct thorough research and ensure your GA4 account is properly configured to accurately track ‘key events.’
Now, take action and tackle your bounce rate head-on!
Original news from SearchEngineJournal